
Do you remember how just a few years ago it was a disaster to lose a camera at the end of a vacation? All memorable pictures and videos then disappeared along with the lost device. Probably, this fact prompted the great minds to invent cloud storage, so that the safety of records no longer depends on the presence of the devices on which these records are made.
Recording video streams on the server side during streaming seems to be such a natural function that many of our users don't even consider it as a job for the server. Such statements from users are not uncommon:
"My server is idle, only background recording is going on"
But if "only recording" is going on the server, then at least there are video streams, otherwise what should be recorded? Therefore, the server is not so idle as it seems. And the recording itself still consumes some resources of the processor and RAM. Also, you need to allocate disk space for storing the records but it depends on the task and how many records you need to store and in what quality.
Let's look at how video recording is implemented on the server side using the example of WCS. The browser or mobile application connects with WCS and sends a WebRTC video stream. WCS records and saves this video stream in the server file system as WebM or mp4 files, then these records are available for downloading and/or further processing. For example, you can transfer them to Amazon S3 cloud storage.

MP4 for H.264 + AAC codecs;
WebM for VP8 + Vorbis codec
When recording a large number of publications at the same time, saving files to disk at the end of the recording can take a lot of time. Therefore, when choosing media for recording storage, pay attention not only to the capacity, but also to the speed of operation (IOPS) and choose the fastest options.
So the task is to organize recording of 100 WebRTC streams published on your WCS server. This type of work can be used for organizing, for example, a video surveillance system, when it is important not only to watch the stream in real time, but also to save records in case of any incidents. Historically, your infrastructure has used AWS instances, most of which are c5.4xlarge, and WCS instances are no exception. The solution for organizing the recording of streams does not look complicated — just one REST command for each stream and everything works well. But suddenly, just a few minutes after the start of the recording, the monitoring system alarms begin to overflood your phone - everything is bad, everything is broken!
So, let's run tests and see why this could happen.
Testing Plan

Publish the stream from the camera on the WCS#1 server
Using the Console web application, take a stream from the WCS#1 server to WCS#2. In this case, 100 incoming WebRTC streams to be recorded are created on the WCS#2 server
Using a script with REST requests, start recording WebRTC streams coming to WCS#2
Select a random stream on WCS#2 and visually evaluate degradation (or absence) of the stream during the recording of the streams
Stop recording WebRTC streams on WCS#2 using a script with REST requests
Estimate the load on the WCS#2 server by the values of the metrics collected by the Prometheus monitoring system for the WCS#2 server.
Testing is considered successful if the recording files are generated and no degradation of streams is seen in the monitoring results or visually.
Preparation for Testing
To test the recording, we used two c5.4xlarge AWS instances with the following characteristics:
16 vCPU;
32 Gb RAM;
10Gbps;
Web Call Server is adapted to run in an Amazon EC2 environment with a few clicks, and you can also manually deploy WCS on an Amazon EC2 instance. After installing the server, we slightly optimized the settings — enabled ZGC and indicated how many processor streams to use for the recorder:
file_recorder_thread_pool_max_size=8Sample files with WCS settings — flashphoner.properties and wcs-core.properties can be downloaded in the Useful Files section.
The WCS#2 instance used to test the recording is connected to Prometheus+Grafana. In this testing, we will track the following metrics:
Processor load:
node_load1
node_load5
node_load15
Physical memory for Java:
core_stats{instance="your.WCS.server.name:8081", job="WCS_metrics_statistic", param="core_java_freePhysicalMemorySize"}
core_stats{instance="your.WCS.server.name:8081", job="WCS_metrics_statistic", param="core_java_totalPhysicalMemorySize"}
Pauses in the work of ZGC:
gc_stats{instance="your.WCS.server.name:8081", job="WCS_metrics_statistic", param="gc_last_pause_ms"}Network bandwidth:
network_statsNumber of incoming WebRTC streams:
streams_stats{instance="your.WCS.server.name:8081", job="WCS_metrics_statistic", param="streams_webrtc_in"}Number and percentage of degraded streams:
degraded_streams_stats{instance="your.WCS.server.name:8081", job="WCS_metrics_statistic", param="degraded_streams"}
degraded_streams_stats{instance="your.WCS.server.name:8081", job="WCS_metrics_statistic", param="degraded_streams_percent"}
Number of open recorders (the number of streams for which the recording is in progress)
recording_stats{instance="your.WCS.server.name:8081", job="WCS_metrics_statistic", param="recording_sessions"}Disk space usage (%)
100 - node_filesystem_avail_bytes{instance='your.WCS.server.name:9100' , fstype!='tmpfs'} / node_filesystem_size_bytes * 100
A ready-to-use panel for Grafana can be downloaded in the Useful Files section.
Testing
After completing all the preparatory work, proceed to testing.
Create streams for recording using the Console web application:
On the first WCS#1 server, open the Console app via HTTP http://your.WCS.server.name:9091/client2/examples/demo/streaming/console/console.html
Specify the domain name or IP address of the first server and click the Add node button. This will be the source server for the WebRTC stream. Then, in the same way, connect the second WCS server to the console to capture streams for recording.

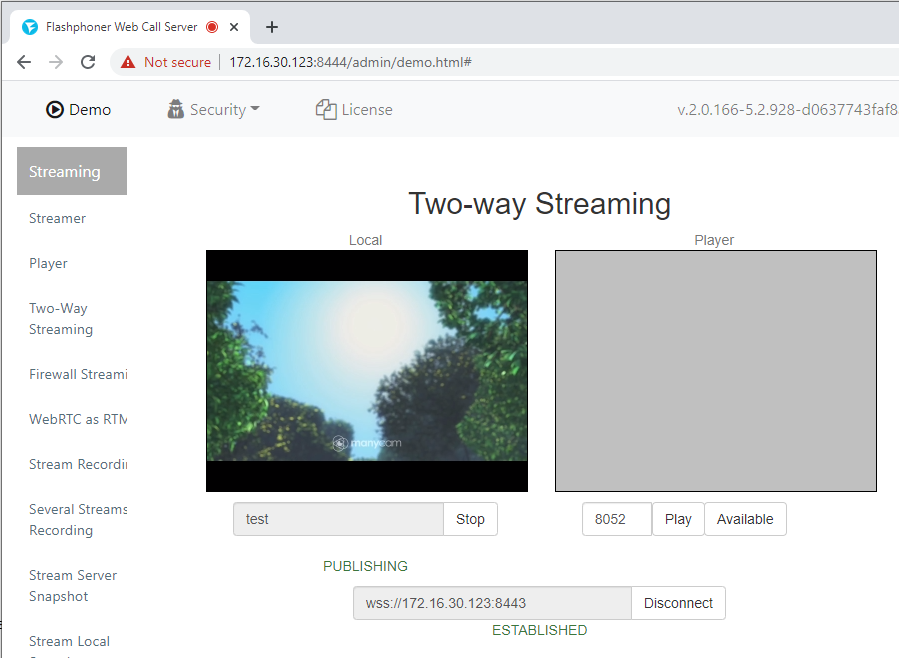
For the first server, run the standard Two-way Streaming instance and publish the stream from the webcam. You can choose any stream name.
In the Console application, select the WCS#2 server, click the Pull streams button and set the parameters for capturing streams:
Choose node — select the first server;
Local stream name — specify the name of the stream on the WCS#2 server to capture the stream from the first server (an index corresponding to the number of the captured stream will be added to the stream name). The specified stream name will be further used in the script for recording streams (in our example "Stream-");
Remote stream name — specify the name of the stream published on the first server;
Qty — indicate the number of viewers (for our testing - 100).
Click the Pull button to start capturing streams.

We start recording the captured streams using the script:
#!/bin/bash
qty=100

for i in `seq 1 $qty`; do
   DATA='{"name":"Stream-'$i'", "published":true, "display":["metrics"]}'
   curl --data "$DATA" -X POST -H "Content-Type: application/json" http://localhost:8081/rest-api/stream/find > stream.txt
   mediaSession=`grep -P -o '(?<=\"mediaSessionId\"\:\").*(?=\"\,\"name\")' stream.txt`
   DATA_rec='{"mediaSessionId":"'$mediaSession'", "config":{ }}'
   curl --data "$DATA_rec" -X POST -H "Content-Type: application/json" http://localhost:8081/rest-api/stream/startRecording -nostdin -nostats </dev/null >/dev/null 2>&1 &
done
where:
qty - number of recorders to create.
Using the REST request /stream/find, we get a list of streams that exist on the server to determine the media session ID, then with the request /stream/startRecording we start recording the stream in the corresponding media session.
You can see the test result in the screenshot:
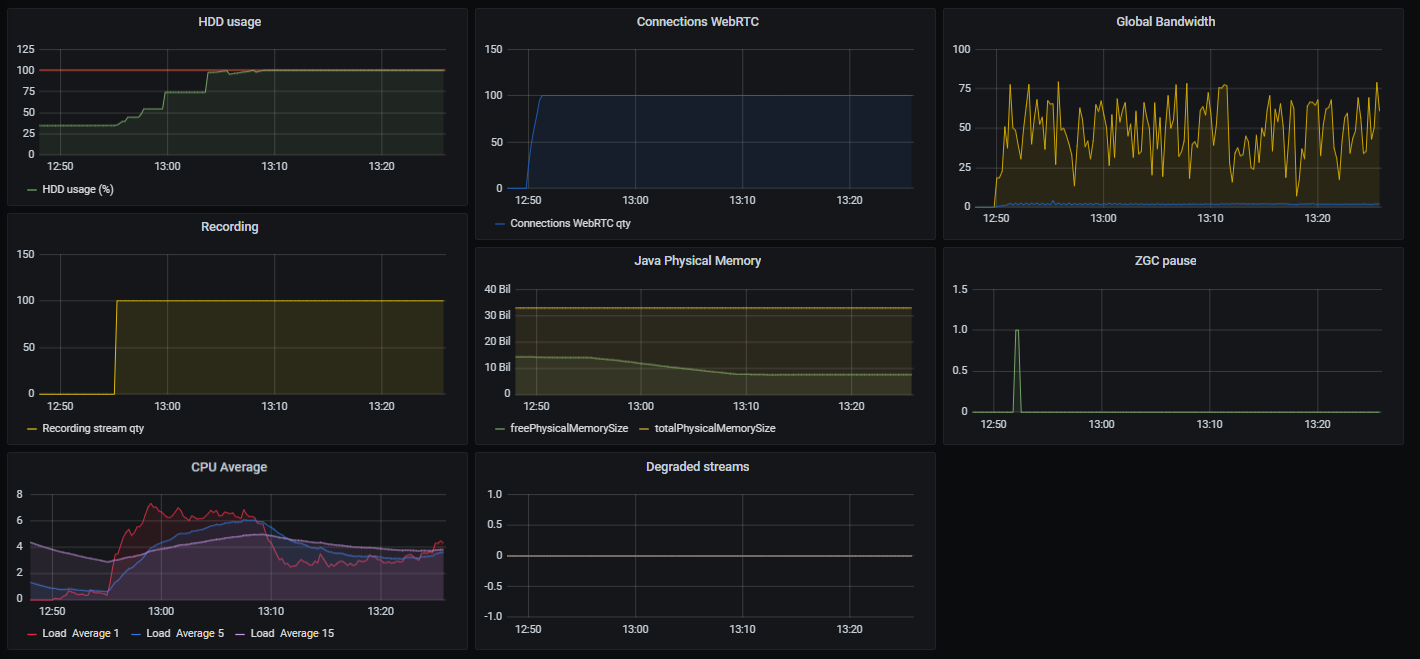
Here you can see that about 15 minutes after the start of the test, the recording files took up 100% of the disk space. For this reason, despite the small load on the server resources (Peak load average 1 is less than 8 units) and the absence of degraded streams, the test cannot be considered passed. This is because AWS only provides 8GB of storage space for a c5.4xlarge instance. Therefore, a quite large number of records in a test very quickly takes it up completely.
In the first test, we published the stream using the standard Two-way Streaming example and the stream was published with 320x240 parameters, this is a rather "small" stream that does not load the server too much. The bitrate of this stream will be about 0.5 mbps. The generated recording file for one such stream takes about 65 kilobytes of disk space per second.
Let's see how our server will behave if we publish a "fat" stream - 1080p (FullHD) with an average bitrate of 2.5 mbps. For one stream with these parameters, the growth of the recording file will already be about 300 kilobytes per second, which is much faster than for a 240p stream.
In this case, we will start publishing the stream using the Media Devices example, where we will set the frame size to 1920x1080:

Then we will run the test in the same way as the previous one. The test result is shown in the screenshot below:

The test with a 1080p stream, as expected, showed a result similar to the previous test - the recordings again took up 100% of the available disk space, and therefore the server could not continue to work. In the case of a "large" stream, the time during which the records took up all the available space was about 5 minutes. This is three times faster than in the previous test with a "small" stream. So, we have seen in practice that the higher the resolution and bitrate of the stream, the more disk space recording files take up.
Let's change the test conditions a little. During testing, we will stop recording and move the generated recording files. The results of this test are shown below:

This test can be considered passed. The server load was small (Load Average 1 was less than 8 units), no degraded streams were recorded. If you use this scenario, take into account that when recording "large" streams, you need to move "pieces" of video more often than for "lighter" streams (with low resolution and bit rate).
To cut pieces of a recording, it is not necessary to stop recording, as we did in the test, you can use "Record File Rotation configured using the record_rotation parameter in the flashphoner.properties file.
For example,
record_rotation=20sets the duration of the piece to 20 seconds, and
record_rotation=10Msets the piece size to 10 megabytes.
As a result, we can conclude that the c5.4xlarge instance is sufficient for long-term recording of 100 WebRTC streams, provided that external storage or an additional disk is used for recordings.
Let's confirm this statement with a test. We will repeat the test with a 125 GB st1 disk connected to the instance. AWS claims 500 IOPS for these drives, which is several times bigger than the performance of the SSD that comes with the default instance.

Thus, we have confirmed the statement that a c5.4xlarge instance is sufficient for long-term recording of 100 WebRTC streams, provided that an additional disk is used for recordings. In this case, the test results were less dependent on the speed of the processor streams and RAM. The key metrics were disk write speed and free disk space. On your hardware, you may get different test results. Simply put, a test on powerful hardware servers will show better values than a test on average "virtual machines." Therefore, when conducting a test, you need to try to create an environment close to your real task.
Have a good streaming!
Useful Files
Panel for Grafana:
WCS Settings:
Test Scripts:
Start recording:
Stop recording:
